Significance of Transformer Oil Testing
Introduction:
Transformers are the vital component of power transmission and distribution system. Transformers are also important equipment in industries like power generation units, steel and aluminum industries, chemicals and fertilizer industries. In order to provide a reliable and continuous supply of electricity to the consumers, trouble free operation is essential. A large numbers of consumers covering a huge area are affected due to any disorder in transformer. So, it is very necessary to monitor health condition of transformer for maintaining uninterrupted supply of electric power. The discontinuity may happen due to occurrence of faults in circuit breakers and transmission lines but transformer is found to be most vulnerable. The internal condition of transformer gets deteriorated as a result of its exposure to thermal, mechanical, electrical and chemical stresses during their operation [1], increasing risk of failure. Therefore, maintenance of transformer with a minimum failure is the challenging task of electric power utilities [2-3]. Several diagnostic and monitoring procedures and tools are available for preventing unexpected failure and reducing time of outage from service. The most common diagnostic and monitoring techniques used are Dissolved Gas Analysis, Oil Parameter Analysis, Furan Analysis, Dielectric Response Measurement, Partial Discharge analysis, Winding Displacement and Deformation assessment, Infrared Thermography etc. [2-4]. It is universally accepted that the life of a power transformer largely depends on the condition of the paper – oil insulation system [5-6]. It is experienced that the majority of failures that occurs in a transformer can be effectively diagnosed through systematic analysis and monitoring of transformer oil. Adequate standards are available for proper monitoring of liquid dielectrics as given in Annexure I. Among these, there are about 20 numbers of tests for analyses of transformer oil shown in Table 1 are most commonly in practice.
Abstract:
Transformer is one of the vital components in power transmission and distribution system. Life of this costly component can be extended beyond 40 years or even upto 50 years or so through regular maintenance that includes several chemical, electrical and physical techniques. Most of the electric power utilities adopt regular analysis of insulating oil samples as a basic requirement of transformer maintenance program. Thermal, electrical and mechanical faults may occur in transformer due to local overheating, hot spot, eddy current and leakage flux, partial discharge, arcing etc. Each of these faults imparts very specific stress on liquid and solid insulation resulting in formation of unique degraded products that are being present in liquid dielectric medium permanently or for a considerable period of time. There can be a big list of the degraded materials so produced but the most important materials are acids, aldehydes, ketones, alcohols, furans, sludge, fibers and gases. Presence of these materials changes the basic property of the oil. Analysis of these changes in oil properties as well as the estimation of these oxidative degraded products present in oil is a powerful tool for assessing the health condition of the transformer. In the present paper, various techniques for analyzing changes in oil parameters and presence of degraded products are discussed through case studies. Two case studies are presented for depicting the effect of change in oil parameter, two case studies are devoted for explaining role of DGA and three case studies are discussed towards assessing status of solid insulation.
Table 1 List of important Indian Standards used for transformer oil analysis including assessment on incipient fault and status of solid insulation.
Sl. No. | ||||
1 | 2006 | 2016 | Mineral Oi-impregnated electrical equipment in services – Guide to the interpretation of dissolved and free gases analysis | |
2 | IS 12177 | 1987 | 2018 | Methods of Tests for Oxidative Ageing of Electrical Insulating Petroleum Oils by Open Beaker Method |
3 | IS 12422 | 2017 | 0 | Unused Hydrocarbon Based Insulating Liquids – Test Methods for – Evaluating the Oxidation Stability (First Revision) |
4 | IS 12463 | 1988 | 2008 | Inhibited mineral insulating oils |
5 | IS 12958 | 1990 | 2016 | Oxidation stability of inhibited mineral insulating oil by rotating bomb – Method of test |
6 | IS 13567 | 1992 | 2008 | Determination of Water in Insulating Liquids and in Oil-impregnated Paper and Pressboard by Automatic Coulometric Karl Fischer Titration – Method of Test |
7 | IS 15668 | 2006 | 2016 | Mineral insulating oils – Methods for the determination of 2-furural and related compounds |
8 | IS 1866 | 2017 | 0 | Mineral Insulating Oils in Electrical Equipment Supervision and Maintenance Guidance |
9 | IS 335 | 1993 | 2010 | New insulating oils |
10 | IS 6103 | 1971 | 2016 | Method of test for specific resistance (resistivity) of electrical insulating liquids |
11 | IS 6104 | 1971 | 2016 | Method of test for interfacial tension of oil against water by the ring method |
12 | IS 6262 | 1971 | 2016 | Method of Test for Power Factor and Dielectric Constant of Electrical Insulating Liquids |
13 | IS 6792 | 2017 | 0 | Insulating Liquids – Determination of the Breakdown Voltage at Power Frequency – Test Method (Second Revision) |
14 | IS 6855 | 2017 | 0 | Method of Sampling Insulating Liquids (Second Revision) |
15 | IS 9434 | 1992 | 2008 | Guide for sampling and analysis of free and dissolved gases and oil from oil-filled electrical equipment |
16 | IS 16084 | 2013 | Mineral Insulating Oils – Determination of Kinematic Viscosity at very Low Temperatures | |
17 | IS 16085 | 2013 | Mineral Oil-Filled Electrical Equipment – Application of Dissolved Gas Analysis (DGA) to Factory Tests on Electrical Equipment | |
18 | IS 16086 | 2013 | Insulating Liquids – Determination of the Dielectric Dissipation Factor by Measurement of the Conductance and Capacitance – Test Method | |
19 | IS 16497 : Part 1 | 2017 | 0 | Test Methods for Quantitative Determination of Corrosive Sulphur Compounds in Unused and Used Insulating Liquids Part 1 Test Method for Quantitative Determination of Dibenzyldisulfide (DBDS) |
20 | IS 16310 | 2017 | 0 | Insulating Liquids – Test Method for Detection of Potentially Corrosive Sulphur in Used and Unused Insulating Oil |
Properties of Liquid Dielectrics:
Among the various parameters described in Table 1 some specific parameters of liquid dielectrics are considered as most essential for assessing the serviceability of the oil. The properties of liquid dielectrics are classified as:
- Electrical properties: Dielectric strength, specific resistance, dielectric dissipation factor.
- Chemical properties: Water content, acidity, sludge content.
- Physical properties: Inter facial tension, viscosity, flash point, pour point.
Electrical Properties of Liquid Dielectrics
Dielectric Strength of Liquid Dielectrics
Dielectric strength of liquid dielectrics or Break down voltage (BDV) is the voltage in kV at which electric sparking starts between two electrodes immerged in the oil with a specific gap of 2.5 mm. It is the ability of the oil to withstand electric stress without failure. Low value of BDV indicates presence of contaminants such as water, dirt, or other conductive liquid or particles. For measuring BDV of transformer oil, BDV measuring kit is used. Oil to be tested is placed in a cell containing one pair of electrodes placed with a gap of 2.5 mm (in some cases the gap is 4 mm). The voltage is increased at a rate of 2 kV/s and reading is taken as BDV where sparking starts between the electrodes. The measurement is carried out for 3 to 6 times for the same sample of oil and the average value of these readings is reported as BDV of the oil tested. Clean and dry oil shows relatively high BDV though the oil may not be completely free from any contamination. This is due to the fact that the quantity of contaminants present between the electrodes is not large enough to affect the average breakdown voltage of the liquid. It is reported that careless sampling and testing technique has been the source of 99 percent of “bad” dielectric readings [7].
Specific Resistance of Transformer Oil
The specific resistance of transformer oil is a measure of its dc resistance between opposite sides of a cubical block of 1 cm3 of oil at 500 V dc. The measurement is carried out through any one of four types of cells specified in IS 6103 [8]. The specific resistance of oil is reported in unit of ohm-cm at a specific temperature. Specific resistance is temperature sensitive and with increase in temperature the resistivity of liquid dielectrics decreases rapidly. The temperature at which the referee test is made should be mutually agreeable to the purchaser and the manufactures. Resistivity measurements can be carried out at desired temperatures. For acceptance tests, it is generally made at 90oC, while for routine testing; it is generally made at room temperature or 90oC. In some research investigations, tests may be made at considerably higher temperature. Low value of resistivity is indication of high concentration of conductive contaminates like free ions and charges particles in the insulating oil.
Dielectric Dissipation Factor of Tan Delta of Transformer Oil
The Tan Delta or power factor of insulating oil is the cosine of the phase angle between an ac voltage applied and the resulting current. It indicates the dielectric loss of the insulating oil or energy that is dissipated as heat. The tan delta test is widely used as an acceptance and preventive maintenance test for liquid dielectrics. A high tan delta of aged service oil is indication of degradation, contamination, or both along with water, carbon particle, or degradation products. For mineral oil, the power factor of new oil should not exceed 0.002 at 90oC. Service-aged oil with a power factor in excess of 0.2 should be further analyzed in a laboratory to determine the cause of the high power factor. Oil with a tan delta in excess of 1.0 may cause operational hazard and should not be useful for even lower voltage capacity transformers. The oil with very high tan delta is to be either reconditioned or replaced.
Chemical Parameters of Transformer Oil:
Water Content in Transformer Oil
Water content in transformer oil is extremely undesirable as it reduces the dielectric properties of transformer oil. Water may be present in transformer oil in the form of free water, physically dissolved water and chemically bonded water. There is a saturation limit for water in oil at specific temperature and free water gets separated from oil if the amount of water exceeds the limit. This occurs due to lowering in operating temperature of a transformer having solid insulation with excess water. Aged transformer oils contains large amount of polar oil decay products. These polar materials stabilize water molecules through hydrogen bonding and micelle formation. The physically adsorbed water in paper reduces drastically the insulating properties of the oil causing risk in safe functioning of the transformer. Chemically bound water is produced through reactions between oxidized compounds present in highly aged oils at high temperatures. This form of water is released at higher temperatures causing extensive reduction of insulation property of oil. It is very difficult to remove chemically bonded water. The polar materials like acids, carbonyls, alcohols are needed to remove from oil prior to removal of water.
The water present in transformer oil also adversely affects solid insulation of core and winding. Paper being highly polar and hygroscopic absorbs the maximum amount of water from oil which affects insulation property paper as well as reduces its life. Water content of oil increases due to release of water from paper insulation when the transformer is being operated at elevated temperature. The water content in oil is allowed up to 50 ppm as recommended by IS 335:1993 RA 2010 [9]. Advanced technique like Karl Fisher Coulometric Titration is useful for accurate measurement of water content especially when it is at a low level.
Acidity of Transformer Oil
The acid neutralization number is estimated through titrometric determination of the amount of acidic compounds present in the oil. The amount of potassium hydroxide (KOH in mg) required to neutralize the acid in one gram of oil is termed as acid number. Acidity of transformer oil increases with ageing. Presence of contaminants like paints, varnish may also increase acidity of oil. Acidity of oil is responsible for decreasing insulation property of oil, increasing water solubility of oil, deterioration of solid insulation, acceleration in oxidation process of oil, corrosion of iron and other metallic components in transformers etc.
Physical Parameters of Transformer Oil
Inter Facial Tension of Transformer Oil
Interfacial tension is similar to surface tension where cohesive forces between liquid molecules at the interface of oil and water are involved. The molecules at interface do not surrounded by similar molecules and as a result they cohere more strongly to those directly associated with them. The dissimilarity of molecules is more at an interface of water and good oil and so IFT is relatively high. However, at the interface between water and aged oil with more polar contents and greater hydroscopic property, the molecular dissimilarity is reduced and consequently lower IFT is observed. Transformer oil should have specific IFT value that depicts its quality, cleanliness and free from polar impurities. Interfacial tension between the water and oil interface is typically measured in Dyne/cm or milli-Newton/meter. IFT is useful to assess the extent of polar contaminants and degraded products the oil contained. Good and new oil generally exhibits high interfacial tension whereas the old shows lower IFT.
Flash Point of Transformer Oil
Flash point of transformer oil is the lowest temperature at which it gives up adequate quantity of gaseous component to form an ignitable mixture in air. This mixture provides a momentary flash when it is subjected to a flame under specified condition. Flashpoint is considered as an important parameter of transformer oil because it depicts the possibility of fire hazard in the transformer. So it is desirable to have a very high flash point of transformer oil. In general it is more than 140oC. Flash point test is carried out in Pensky-Martens closed cup apparatus as per ASTM D3828 and IS 1448 [P:20] :1998.
Pour Point of Transformer Oil
The minimum temperature at which the liquid dielectrics start flowing under the prescribed conditions is known as the pour point. Pour point is an important property especially for geometric locations where the ambient temperature is very low. The oil temperature of transformers installed in those places may fall below the pour point causing cessation of convection flow with a significant hindrance in cooling processes. Therefore, pour point is preferred as low as possible so that oil can start flow even at low temperatures. Paraffin-based oil exhibits a higher value of pour point as compared to Naphtha based oil. The ambient temperature at majority of places in India is much above 0oC and so both the oils can be used safely. The wax content of oil greatly influences its Pour Point. Due to higher wax content of Paraffin-based oil, it shows higher pour point.
Viscosity of Transformer Oil
Viscosity is a measure of the resistance of oil to continuous flow without any external forces. The oil should have good mobility so that it is effectively transfer heat generated at winding and core through the transformer’s radiator. Transformer oil with low viscosity is preferred as it exhibits less resistance to the conventional flow and hence does not affect the cooling of the transformer. Viscosity of any liquid increases with decrease in operating temperature. But the rate of increase varies from one liquid to other. Low viscosity is essential for transformer oil but it is equally important that the rate of increase is as less as possible with a decrease in temperature.
Experimental Results and discussions:
The petroleum or mineral oil based transformer oil samples considered for this presentation are tested for various parameters following the procedure and guidelines as per IS:335[9] and IS:1866 [10]. IS:335 is applicable for new transformer oils whereas IS:1866 is for insulating oil filled in new transformer and transformer in service. As the present paper is on significance of testing of transformer oil, the oil samples selected are in such a way that the importance of testing can easily be explained and can be conclusive based on the oil parameters studied.
Studies on new oils:
The testing procedure as per guidelines of IS 335:1993 RA 2010, an Indian standard dedicated on testing of new mineral based transformer oil was for followed for analyzing selected oil samples, results of which is shown in Table 2. All the 3 oil samples tested were clear, transparent and free from visible suspended particles with reasonably high Interfacial Tension. Apart from Interfacial Tension, Acidity and Tan Delta are found to be well within the limits defined by the standard. The oils A, B and C may be considered as reasonably good as a new transformer oil based on considering the basic tests generally in practice as stated above. But with the analyses of these oils for all important parameters as per guideline of IS 335 specifically Oxidation Stability and accelerated ageing study through open beaker method, the quality of oils can easily be assessed. The oil samples tested can be graded in a descending order of their quality as Sample C, Sample B and Sample A, Sample C being superior as Sample A as inferior in quality.
Studies on Service Oils:
The insulating oils of transformers in service are periodically monitored for assessing their status of quality as per the test procedure guided by IS 1866:2017/IEC 60422:2013. For service oil parameters like Acidity, IFT, Tan Delta, Resistivity, BDV, Water Content, Flash Point and Sludge Contents are analyzed for assessing the deterioration in oil quality and for establishing a trend of such degradations. Table 3 represents comparison of oil properties of 3 transformer oils tested. Comparison of the results for these parameters of the oils tested was sufficient enough to classify them as Inferior, Moderate and good as shown in Table 3. Instead of 3 grades, The insulating oils of transformers in service are periodically monitored for assessing their status of quality as per the test procedure guided by IS 1866:2017/IEC 60422:2013. For service oil parameters like Acidity, IFT, Tan Delta, Resistivity, BDV, Water Content, Flash Point and Sludge Contents are analyzed for assessing the deterioration in oil quality and for establishing a trend of such degradations. Table 3 represents comparison of oil properties of 3 transformer oils tested. Comparison of the results for these parameters of the oils tested was sufficient enough to classify them as Inferior, Moderate and good as shown in Table 3. Instead of 3 grades, The insulating oils of transformers in service are periodically monitored for assessing their status of quality as per the test procedure guided by IS 1866:2017/IEC 60422:2013. For service oil parameters like Acidity, IFT, Tan Delta, Resistivity, BDV, Water Content, Flash Point and Sludge Contents are analyzed for assessing the deterioration in oil quality and for establishing a trend of such degradations. Table 3 represents comparison of oil properties of 3 transformer oils tested. Comparison of the results for these parameters of the oils tested was sufficient enough to classify them as Inferior, Moderate and good as shown in Table 3. Instead of 3 grades, transformer oils in service can be classified into 5 to 6 grades for a meaningful grouping of large numbers of transformers that are in operation with electric power utilities like WBSETCL, WBSEDCL, OPTCL, DVC, Power Grid etc. Simple computational methods can be used for such classification [11] and the utility can easily chalk out actions needed like filtration, reclamation and replacement programs for long terms and short terms basis. Routine condition monitoring of transformer oil along with computational methods can be useful for asset management also
Table 2 Results of 3 oil samples tested as per IS 335
SI. No. | Parameter | Sample A | Sample B | Sample C |
1 | Density | 0.832 | 0.827 | 0.833 |
2 | Viscosity | 16.3 | 14.5 | 19.4 |
3 | IFT | 42 | 41 | 50 |
4 | Flash Point | 156 | 150 | 177 |
6 | Acidity | 0.0290 | 0.011 | 0.0058 |
7 | BDV | 70 | 54 | 47 |
8 | Tan Delta | 0.0018 | 0.0013 | 0.00078 |
Dielectric constant | 2.04 | 2.03 | 2.01 | |
9 | Resistivity 90oC 27oC | 60 3300 | 75 3000 | 170 5600 |
10 | Water | 8 | 11 | 12 |
11 | OS: Acidity | 0.19 | 0.13 | 0.019 |
12 | OB: Resistivity 27° C 90° Tan Delta Acidity |
75 6.9 0.0051 0.039 |
900 25 0.0038 0.028 |
2450 90 0.00099 0.014 |
The main reason for formation gases in a transformer in service are electrical and thermal stresses. Formation of various gases is observed at minor quantity in all transformers even those are considered as very healthy transformers. Petroleum based transformer oil is a mixture of several hydrocarbons. So, breakdown mechanism of the oil under electrical and thermal stress is a complex process. The major gases produced considered as key gases are Hydrogen (H2), methane (CH4), acetylene (C2H2), ethylene (C2H4), and ethane (C2H6). Also, degradation of paper insulation produces methane (CH4), hydrogen (H2), carbon monoxide (CO), and carbon dioxide (CO2). Quantity of these gases produced is useful for understanding the internal health condition of transformer as shown in Table 4 and Table 5. In this paper, two cases of trend analysis of DGA, of a very healthy transformer and a transformer with severe fault are discussed.
Table 4. Dissolved gas concentration limit for interpretation of fault level as per ANSI/IEEE C57.104
Dissolved gas concentration limit (ppm) | Interpretation | |||||||
Hydrogen (H2) | Methane (CH4) | Acetylene (C2H2) | Ethylene (C2H4) | Ethane (C2H6) | Carbon monoxide (CO) | Carbon dioxide (CO2) | TDCG (*) | |
100 | 120 | 1 | 50 | 65 | 350 | 2500 | 720 | Satisfactory |
101 – 700 | 121 – 400 | 2 – 9 | 51 – 100 | 66 – 100 | 351 – 570 | 2500 – 4000 | 721 – 1920 | Fault may be present |
701 – 1800 | 401 – 1000 | 10 – 35 | 101 – 200 | 101 – 150 | 571 – 1400 | 4001 – 10000 | 1921 – 4630 | Fault probably present |
>1800 | >1000 | >35 | >200 | >150 | >1400 | >10000 | >4630 | Continued operation could result in failure |
Table 5. Permissible concentration of gases in healthy transformer (Transformer Union AG)
GAS | <4 YEARS | 4-10 YEARS | >10 YEARS |
HYDROGEN METHANE ETHANE ETHYLENE ACETYLENE CO CO2 | 100-150 50-70 30-50 100-150 20-30 200-300 3000-3500 | 200-300 100-150 100-150 150-200 30-50 400-500 4000-5000 | 200-300 200-300 800-1000 200-400 100-150 600-700 9000-10000 |
DGA were conducted in every four months of oil taken from a faulty 315 MVA 400/220/33 kV Transformer. The results of the measurements are shown in Figure 1. It is seen from the Figure that the rate on increase of ethylene gas is relatively higher than other 2 gases methane and ethane. In order to get a quantitative evaluation of the rate, linear curve fitting was performed. If a linear growth is considered for simplifying the situation, it is observed that the rate of increase of Ethylene, Methane and Ethane was 8.8, 4.8 and 2.3 ppm per day. This rate of increase in key gas concentrations can be considered as very high and the fault condition of the transformer is considered as severe one. Among the key gases, acetylene is the most dangerous as it is generated due to arcing. As DGA did not show significant amount of acetylene, the fault need not be considered as most severe even though the gas generation is very high.
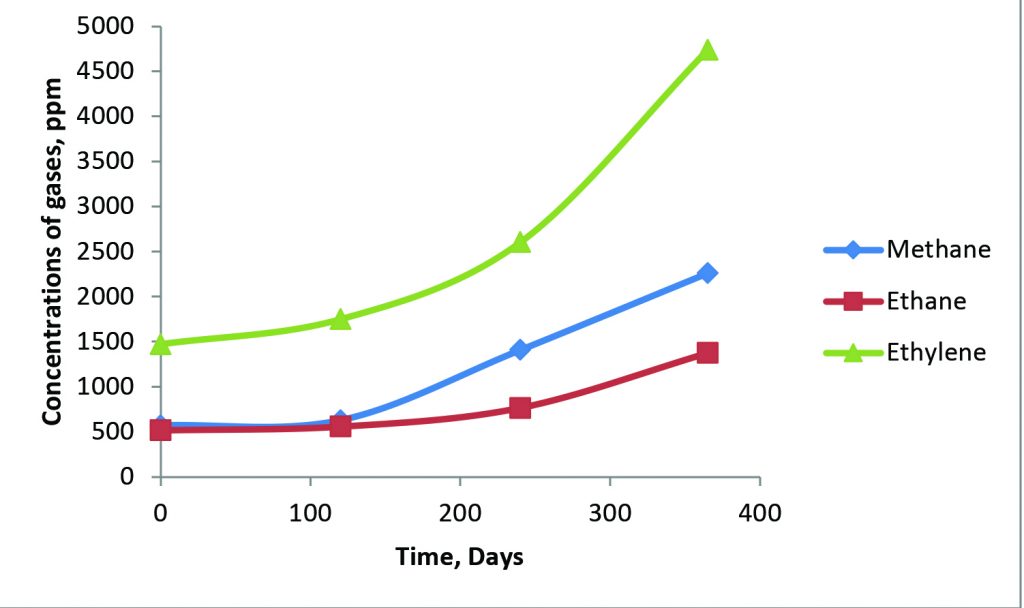
Table 6 shows the DGA analysis of a 330 MVA 400/16.5 kV Transformer, for a period of one year. It is seen that there is no significant change in concentrations of any key gas. The transformer is considered as very healthy. However, it is required to monitor the transformer through DGA at least twice in a year. It is to be noted that to maintain the transformer in this state of healthiness, annual oil parameter testing is equally important.
Table 6 DGA Trend analysis shows healthiness in a 330 MVA 400/16.5 kV Transformer,analysis conducted quarterly
| Time in Months | |||
Gases | Initial | 4 | 8 | 12 |
Methane | 1 | 1 | 1 | 1 |
Ethane | ND | ND | ND | ND |
Ethylene | 1 | 1 | 1 | 1 |
Acetylene | ND | ND | ND | ND |
Hydrogen | 2 | 2 | 3 | 6 |
O2 | 11034 | 10867 | 10599 | 10400 |
N2 | 37173 | 38986 | 37874 | 38035 |
CO | 7 | 13 | 16 | 17 |
CO2 | 189 | 233 | 332 | 315 |
Studies on Assessment of Solid Insulation through Furan Analysis:
Papers in different forms are used as solid insulation in transformer. It is reported [17] that the remaining life of an old transformer in service mostly depends on the mechanical strength of solid insulation. Measurement of tensile strength and degree of polymerization (DP) are followed for evaluating solid insulation. DP value of 150-250 is considered as end-of-life of paper insulation. It is required to remove paper samples from suspect place of the transformer for measurement of DP and is only possible during transformer repairs. The simplest way of measuring the condition of solid insulation is through analysis of furan present in oil. Paper on degradation produces furanic compounds that remained dissolved in transformer oil. Furan Analysis is carried out as per IS 15668: 2006 (RA 2016)/IEC 61198 : 1993 [18].
The average DP of paper insulation can be estimated through measurement of type and amount of furans present in an insulating oil sample. The abnormality in stress the transformer experienced can also be judged by measuring amount and types of furan compounds present in oil. Table 7 describes the reason for formation of various furan compounds. The amount of furan present in transformer oil is also been correlated to DP values and status of overall solid insulation of the transformer as shown in Table 8. Formation of Carbon monoxide and carbon dioxide is also related to a considerable extent to degradation of solid insulation. Therefore, measurement of Carbon monoxide and carbon dioxide through DGA can generally be considered as supporting tests.
The present paper describes three cases of furan analysis like normal increase in furan concentration, very high increase and correlation of furan with other oil parameters as shown in Table 9, Table 10 and Table 11 respectively. Table 9 depicts Furan Analysis Results of a 235 MVA, 15.75/230 kV Transformer. It is observed that over the studied period of 3 years, there was no significant increase in furan concentration though the initial concentration was at higher side. The transformer studied was about 30 years old and formation of about 600 – 700 ppb of furan can be considered as an example of very normal deterioration of solid insulation.
Table 7 Type of Furanic compounds produced
5-Hydroxymethyl-2-furaldehyde | 5H2F | Oxidation |
Furfuryl alcohol | 2FOL | High Moisture |
2-Furaldehyde | 2FAL | Overheating, old faults |
2-Furyl methyl ketone | 2ACF | Rare, lighting |
5-Methyl-2-furaldehyde | 5M2F | Local, severe overheating |
Table 8 Significance of Furan concentration and DP values.
Furan Content (ppm) | DP Value | Significance |
0-0.1 | 1200-700 | Healthy transformer |
0.1-1.0 | 700-450 | Moderate deterioration |
1-10 | 450-250 | Extensive deterioration |
>10 | <250 | End of life criteria |
Table 10 shows Furan analysis results of a 16/11.2 MVA, 15.75/6.6 kV Transformer for a period 3 years. It has been seen that during the period of observation, a significant increase in concentration of furan was observed. The transformer under study was also very old with a service length of above 30 years. The analysis indicated a rapid deterioration of solid insulation. It may not be easy to improve in heath condition of solid insulation of this transformer through dehydration. The process of dehydration can only lengthen the life of the transformer to some extent.
Table 9 Furan Analysis Results of a 235 MVA, 15.75/230 kV, Transformer
| Characteristics | Results | Results | Results |
Sl. No. | Furanic Compounds, ppb | August 2014 | August 2016 | August 2017 |
1. | 5-Hydroxymethyl-2-Furfural | 0 | 0 | 0 |
2. | 2-Furfuryl Alcohol | 0 | 0 | 0 |
3. | 2-Furfural | 510 | 670 | 740 |
4. | 2-Acetylfuran | 0 | 0 | 0 |
5. | 5-Methyle-2-Furfural | 0 | 0 | 0 |
| Total | 510 | 670 | 740 |
Table 10 Furan Analysis Results of a 16/11.2 MVA, 15.75/6.6 kV Transformer
| Characteristics | Results | Results | Results |
Sl. No. | Furanic Compounds, ppb | January 2015 | August 2016 | August 2017 |
1. | 5-Hydroxymethyl-2-Furfural | 0 | 0 | 0 |
2. | 2-Furfuryl Alcohol | 0 | 0 | 0 |
3. | 2-Furfural | 660 | 1040 | 1210 |
4. | 2-Acetylfuran | 0 | 0 | 10 |
5. | 5-Methyle-2-Furfural | 0 | 0 | 0 |
| Total | 660 | 1040 | 1220 |
Table 11 shows Furan analysis results along with other important oil parameters of 1.25 MVA, 6.6/0.433 kV Transformers. Though all these transformers are of similar age and rating, a variation in furan contents is observed. If the transformer Tr.4 is kept out of analysis, then it can be infer that acidity, IFT and moisture content may have influence on degradation of solid insulation.
Conclusion:
The oil samples with an appearance of clean, colorless and free from visible suspended particles, supposed to be considered as new transformer oil were compared for their oil properties. Most of the parameters tested showed very promising results to accept all these 3 oils as good quality new oil. But by carrying out two special tests like i) Oxidative ageing by open beaker method as per IS 12177:1987 RA 2018 and ii) Determination of oxidation stability as per Annex C of IS 335:1993 RA 2010, difference between the quality of the oil was very distinctively assessed. It can be inferred from this case study that special tests like accelerated ageing should be recommended for selecting oil for transformers of higher capacities or for sensitive or strategically important transformers such as those are associated with generators in large power plants, if not for transformers of all categories.
Table 11 Correlations of Furan Analysis Results with oil parameters of 1.25 MVA, 6.6/0.433 kV Transformers
| Tr. 1 | Tr. 2 | Tr. 3 | Tr. 4 | Tr. 5 | Tr. 6 |
Furan | 350 | 280 | 430 | 160 | 140 | 130 |
Interfacial tension | 15 | 17 | 15 | 16 | 24 | 24 |
Flash Point | 162 | 158 | 162 | 160 | 161 | 162 |
Acidity | 0.18 | 0.16 | 0.19 | 0.15 | 0.061 | 0.062 |
BDV | 43 | 37 | 26 | 48 | 34 | 36 |
Tan delta | 0.15 | 0.087 | 0.11 | 0.086 | 0.071 | 0.068 |
Dielectric constant | 2.11 | 2.10 | 2.10 | 2.08 | 2.07 | 2.07 |
Resistance | 0.092 1.3 | 0.18 1.9 | 0.13 1.5 | 0.22 2.1 | 0.38 2.7 | 0.38 2.9 |
Water Content | 29 | 26 | 35 | 25 | 24 | 25 |
Viscosity | 23.7 | 22.1 | 23.9 | 22.3 | 21.3 | 20.1 |
Routine testing of oil parameters as per IS 1866:2017/ IEC 60422:2013 is useful for taking up necessary maintenance activities like filtration, reclamation or replacement of oil. It can be effectively utilized for classifying large number of transformers in power utilities for initiating preferential actions in batches. This can also be useful for asset management.
Periodic DGA provides information on the internal condition of transformers whether it is healthy or having faults, type and severity of faults etc. Trend analysis is more informative compared to stand alone data.
Furan analysis provides information on overall condition of solid insulation. The first 2 case studies presented on furan analysis explained the severity in deterioration of solid insulation whereas the last case study is for finding cause of varying degradation rate of solid insulation. It is observed that properties like acidity, IFT and moisture content have greater influence on deterioration of solid insulation.